Measuring Light, Temperature or Moisture:
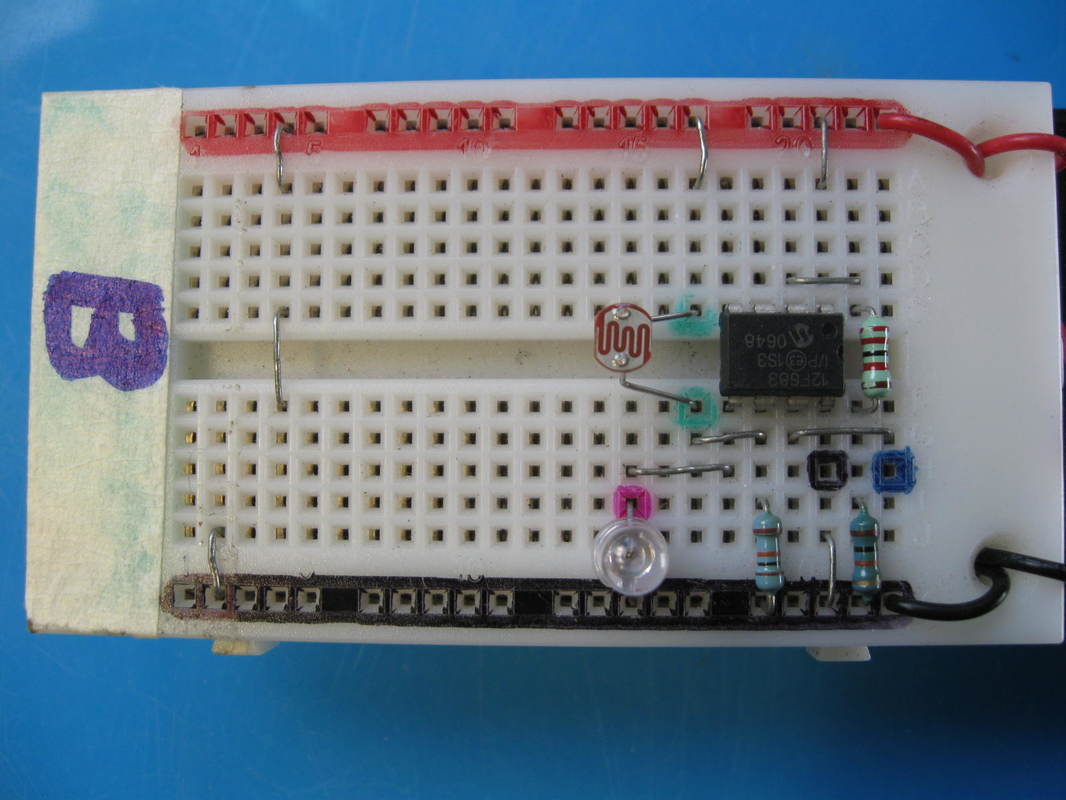
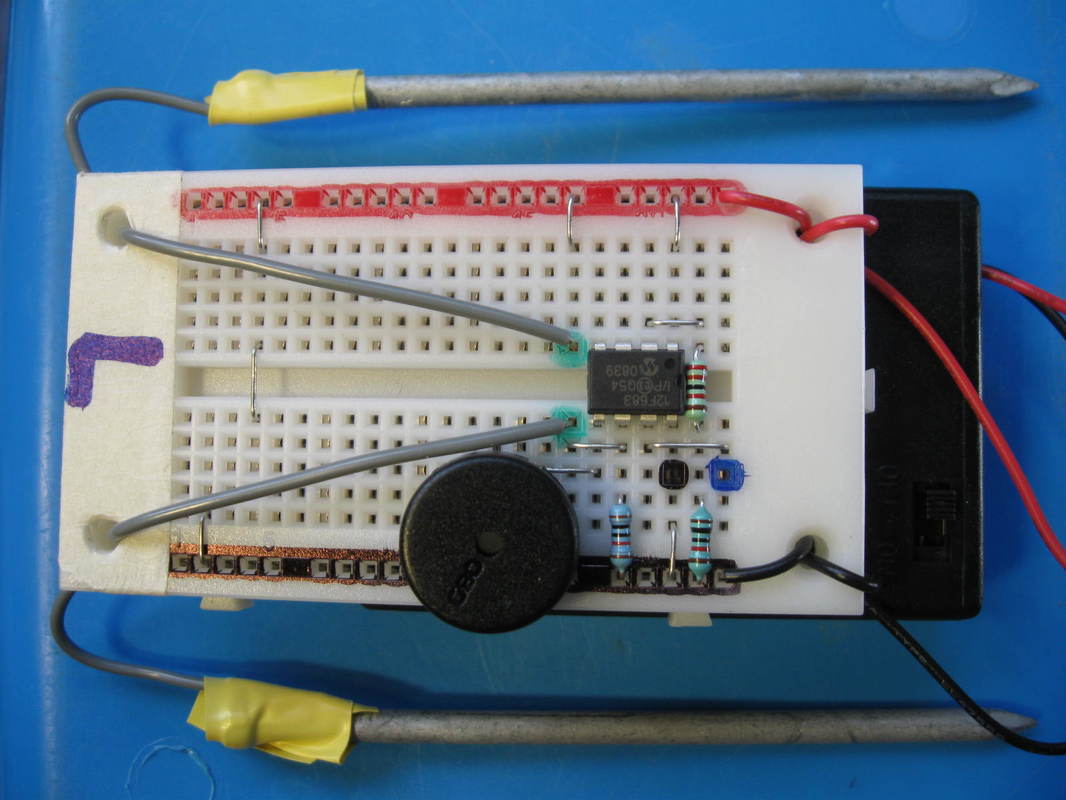
Extra equipment needed: thermistor (for temperature), LDR (for light), nails (moisture). These are all input devices.
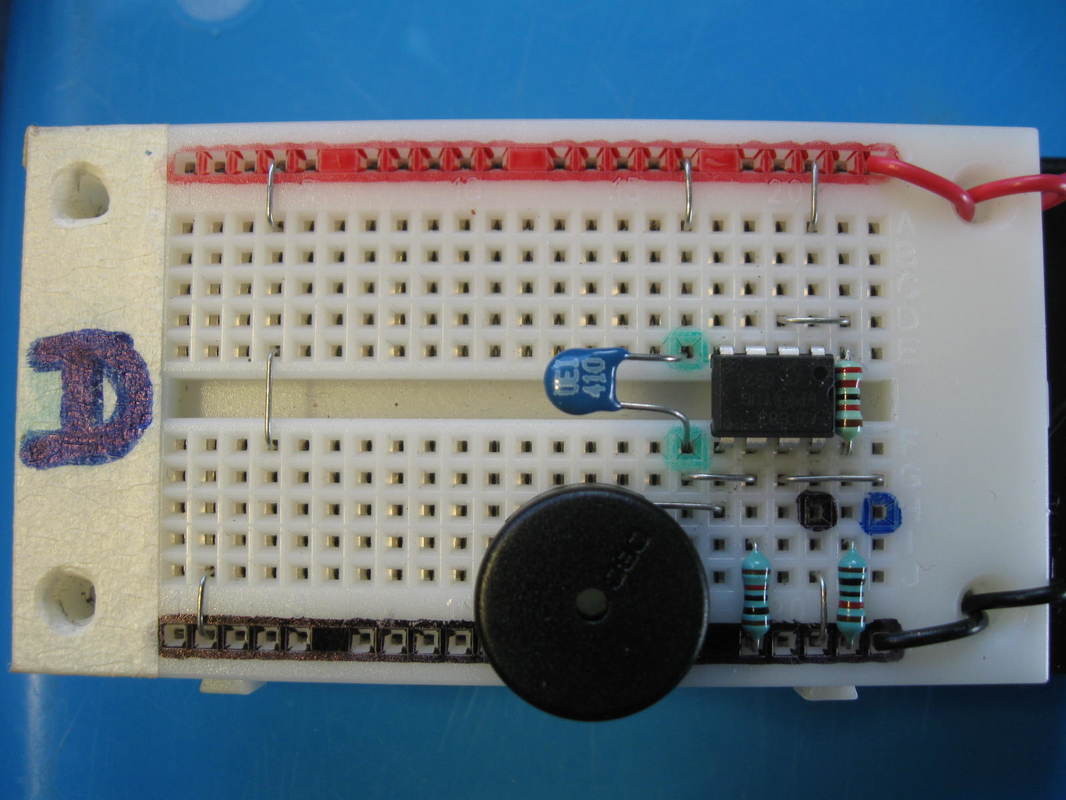
LED or speaker (output devices)
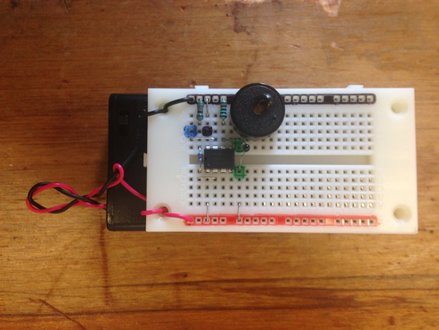
The input device (dependent on what is being measured) is inserted into the two green dots on the breadboard. The output device goes between the ground railing and the pink dot. The programs are the same, no matter which input or output devices you are using.
LED or speaker (output devices)
The input device (dependent on what is being measured) is inserted into the two green dots on the breadboard. The output device goes between the ground railing and the pink dot. The programs are the same, no matter which input or output devices you are using.
STARTER PROGRAM:
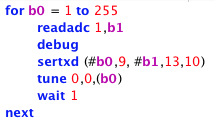
The most basic version of the program enables data to be recorded and to be shown on your computer screen. It does not store the data in any way but rather gives a live feed of information.
'code 9 no notes'
for b0 = 1 to 255
readadc 1,b1
debug
sertxd (#b0,9, #b1,13,10)
tune 0,0,(b0)
wait 1
next
The most basic version of the program enables data to be recorded and to be shown on your computer screen. It does not store the data in any way but rather gives a live feed of information.
'code 9 no notes'
for b0 = 1 to 255
readadc 1,b1
debug
sertxd (#b0,9, #b1,13,10)
tune 0,0,(b0)
wait 1
next
|
Download the program directly:
|
| ||||||
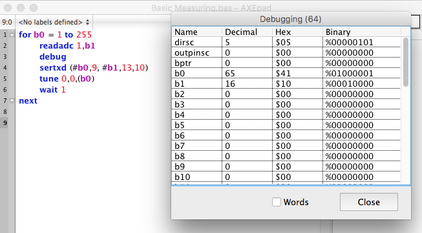
Once you have downloaded this program onto the Picaxe, press F8 on your keyboard to open the terminal. You should see a live feed of the data you are gathering that looks like this:
The value in b0 is the number of the reading. In this example, it's the 65th reading. The value in the b1 column is the reading from the input device, in this case an LDR.
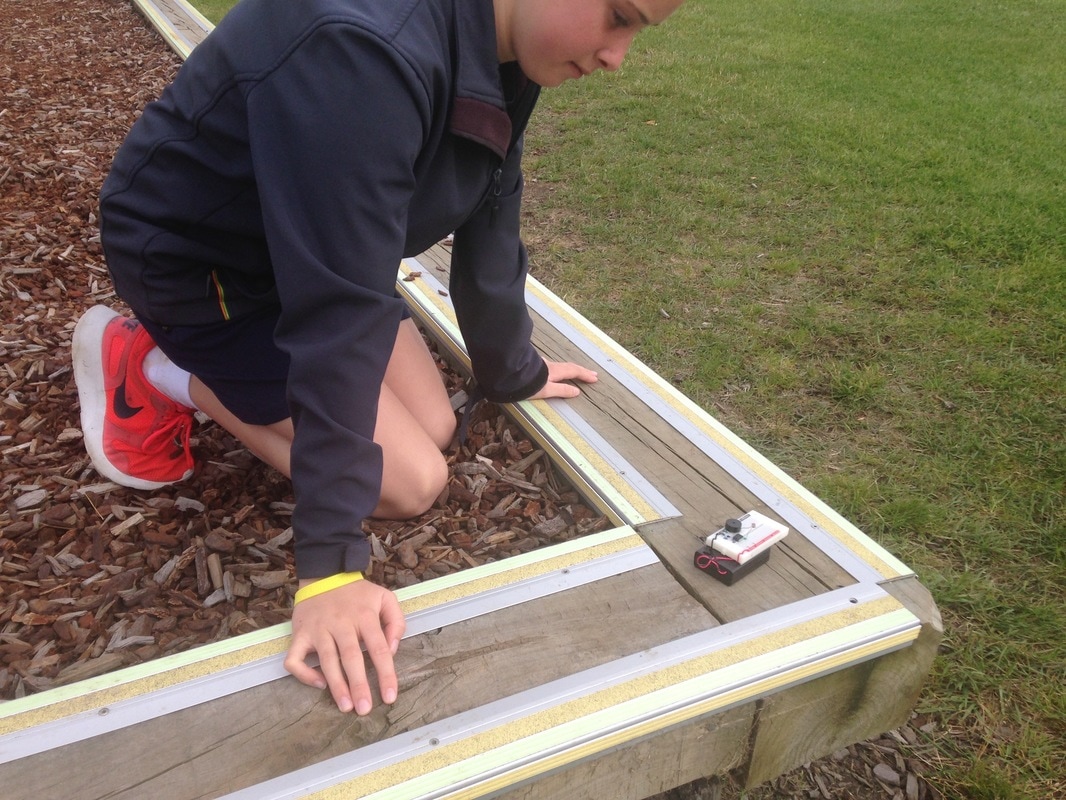
However, to use a picaxe out in the environment, it is not ideal to have it attached to a computer. We want to be able to use it away from the computer and to record data which can be uploaded at a later date and then recorded in a spreadsheet in order to generate a graph.
However, to use a picaxe out in the environment, it is not ideal to have it attached to a computer. We want to be able to use it away from the computer and to record data which can be uploaded at a later date and then recorded in a spreadsheet in order to generate a graph.
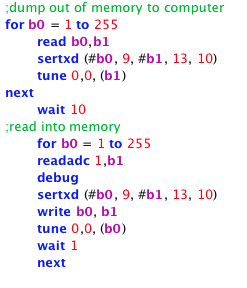
Program the following:
|
Download the program directly: 'Code 10 no Notes'
for b0 = 1 to 255 read b0,b1 sertxd (#b0,9, #b1,13,10) tune 0,0,(b1) next wait 10 for b0 = 1 to 255 readadc 1,b1 debug sertxd (#b0, 9, #b1, 13,10) write b0, b1 tune 0,0, (b0) wait 1 next |
| ||||||
Once you have downloaded the program onto the Picaxe it is ready to take the measurements. The Picaxe will record data for up to 4 minutes and 30 seconds. DO NOT turn the Picaxe off between measurements.
Once you have finished recording all of the data, turn the Picaxe off.
Plug it back into the computer. Press F8 to bring up the terminal window (or select PICAXE...Terminal from the AXEPad menu).
Turn the Picaxe on. You should get a readout of the data you have gathered. Once the readout is complete choose Copy Buffer. This data can then be pasted into a spreadsheet and used to generate graphs.
Additional Notes for Moisture Readings:
Your browser does not support viewing this document. Click here to download the document.
